Why intraday OI reads differently
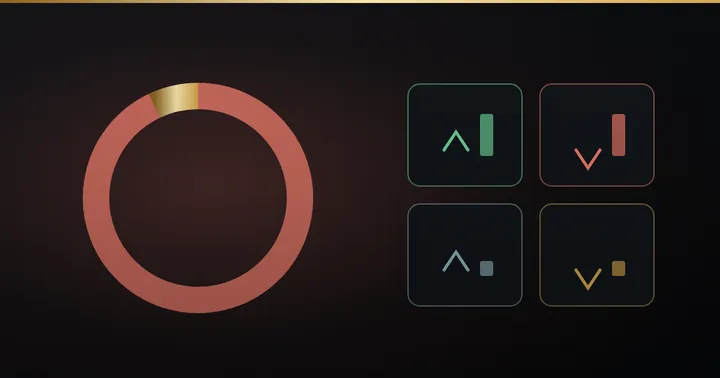
Our earlier post on what open interest shows that price cannot covered the basics: open interest (OI) is the number of futures or options contracts still open, and price plus OI gives you four readings — long buildup, short buildup, short covering and long unwinding. This post is the practical follow-up. It is about open interest analysis during the session, on Nifty and Bank Nifty futures, and about the readings that tend to show up before a fall rather than after it.
Intraday, OI behaves differently from the end-of-day number most traders quote. Three things matter.
- Direction of change beats the level. A total OI of 1.4 crore shares tells you little. Whether OI rose or fell during the last hour while price moved tells you a lot.
- Single bars are noisy. OI updates arrive in snapshots, so on a 1-minute or 3-minute chart the change in OI (written ΔOI) can be lumpy. Read clusters of bars and the session total, not one print.
- Expiry and rollover distort it. In the last few sessions before the monthly expiry, OI in the near-month contract falls as traders roll positions forward. Falling OI then is often rollover, not conviction leaving.
With those in mind, here are the four early warnings worth watching.
Warning 1: the rally on falling OI
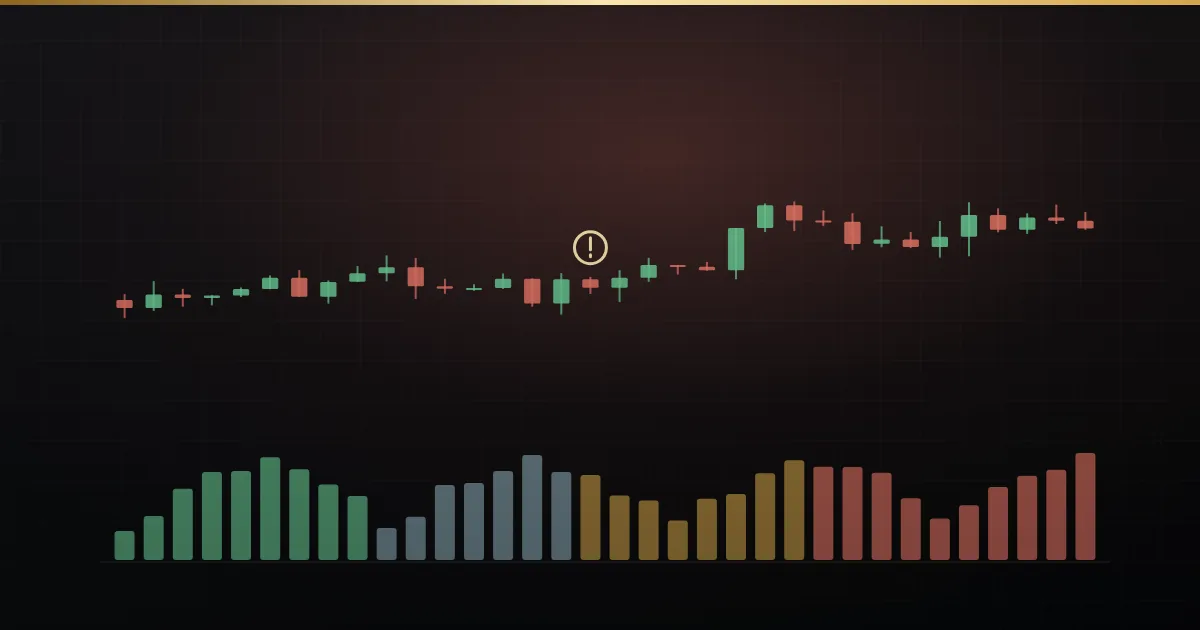
A rally where price rises and OI falls is short covering: traders who sold earlier are buying back to close. The buying is real, but it is buying that ends. Once the last short is out, nobody new is left to push.
Illustration (hypothetical prices): say Nifty futures open at 24,180, dip to 24,120 in the first half hour, then climb to 24,290 by 11:30. The candles look strong. But session OI is down 3% from the open, and most of the up-bars show OI falling. That rally was built by shorts leaving. If price stalls near the morning high and new buyers do not show up — OI stays flat or keeps dropping — the move has no second leg, and a return toward the mid-range is the more likely path.
What would prove it wrong: OI turns up while price holds above the breakout level. That converts short covering into long buildup — new money has stepped in, and the rally now has fuel of its own.
Warning 2: long unwinding near the highs
This is often the first sign of a fall, and it is easy to miss because price has barely moved. Long unwinding is price slipping while OI falls: traders who bought are quietly selling to exit.
Illustration: say Bank Nifty futures trend up through the morning on rising OI — a clean long buildup — and reach 52,400 by noon. From 12:30 the bars drift sideways to slightly lower, and OI starts falling bar after bar. Nobody is shorting yet. The longs who built the move are taking money off the table. That changes the balance: the buyers who held the market up are leaving, so any seller now meets less support.
The fall, when it comes, often starts as unwinding and then turns into short buildup (price down, OI up) as fresh sellers notice the weakness. Catching the unwinding phase gives you the earlier warning.
What would prove it wrong: the dip is bought and OI rises again on the bounce. That means new longs replaced the ones who left, and the trend is being refuelled rather than abandoned.
Warning 3: short buildup into support
Traders love to buy support. The question OI answers is whether support is being tested by tired sellers or by committed ones.
If price drifts down to yesterday’s value area low or a well-watched round number and OI is rising all the way down, new short positions are being opened into that level. Sellers are not exhausted; they are adding. Support under that kind of pressure is more likely to give way, and when it does, the shorts have room to press.
Compare that with price falling to the same level on falling OI. That is long unwinding running out of sellers — the kind of decline that often finds a floor.
What would prove it wrong: price holds the level, and the next push down fails while OI starts falling. The new shorts are now covering, and a bounce from support gains a short-covering tailwind.
Warning 4: OI at key profile levels
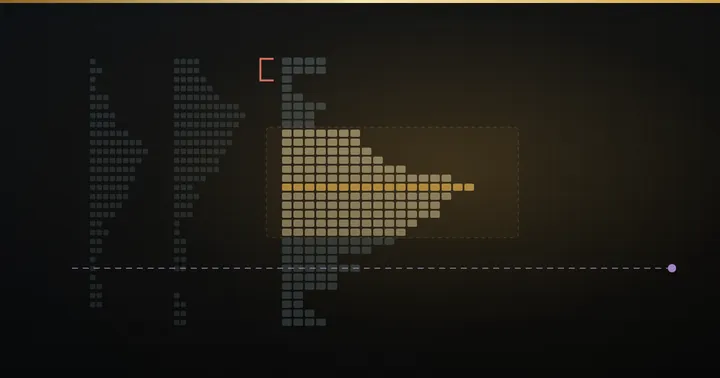
The four OI readings matter more at some prices than others. Location is what turns a reading into a decision. Market Profile gives you those locations: the value area (the price range where roughly 70% of the session traded), its high and low (VAH and VAL), and the point of control (POC), the single price with the most activity.
Open interest adds a second map on top. Instead of asking where most volume traded, you ask where most new positions were built. Those prices tend to be defended, because the traders who opened there have a reason to protect them. Three intraday patterns are worth knowing:
- Unwinding at VAH. Price reaches the top of value and OI falls. Longs are using the high to exit — a common start of a rotation back toward the POC.
- Short buildup through VAL. Price leaves value to the downside on rising OI. Sellers are committing, which makes a quick return to value less likely.
- Covering away from the OI-heavy price. Price runs far from where positions were built, on falling OI. The move is running on exits, and the price with the heaviest fresh positioning often acts as a magnet back.
How Mirra reads OI per bar and per session
Mirra reads live open interest from the Accelpix feed inside NinjaTrader 8, in both the Market Profile and the Order Flow indicators. OI features need an Accelpix Pix Connect feed — without it, the price and volume parts of the indicators still work, but the OI layers have nothing to read.
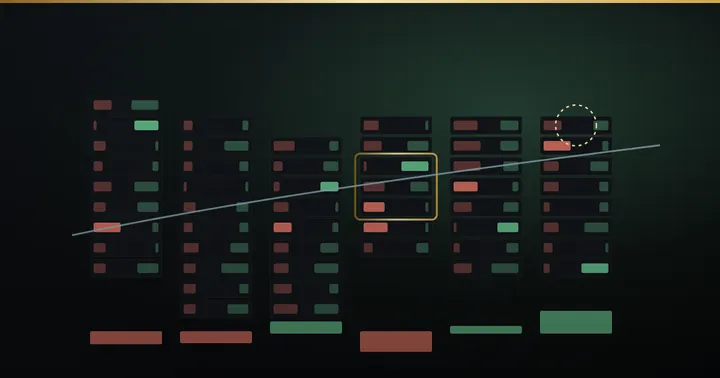
In Mirra Advanced Order Flow, every footprint bar is classified by delta × ΔOI — new longs, short covering, new shorts or long liquidation — and the label is printed under the bar as it forms. An OI intensity column shows ΔOI and ΔOI as a percentage of that bar’s volume, so you can see whether the trades created positions or just passed them between hands. A rally bar with strong buying delta but a short-covering label is Warning 1, caught on the bar itself.
In Mirra Advanced Market Profile & TPO, each session is labelled long buildup, short buildup, short covering or unwinding, with OI/Vol showing whether it was positioning or churn. It also draws an OI value area (OI-VAH and OI-VAL) beside the volume value area, a Conviction POC and CW-POC (the price with the highest positions per lot traded), naked OI-POC magnets carried forward across sessions, and a flow mix that splits fresh, unwind and churn into percentages, rolled into an Auction Conviction Index from 1 to 99.
| Warning | Price and OI | Where Mirra shows it | What would prove it wrong |
|---|---|---|---|
| Hollow rally | Price up, OI down (short covering) | Short-covering label under footprint bars; session buildup label | OI turns up while price holds above the breakout |
| Unwinding near highs | Price flat to down, OI down | Long-liquidation bars; unwind share rising in the flow mix | Dip is bought on rising OI |
| Short buildup into support | Price down, OI up | New-shorts bars; OI intensity column high | Level holds and OI starts falling on retests |
| OI at profile levels | Any reading at VAH, VAL or the OI-POC | OI value area, Conviction POC, naked OI-POC magnets | Price accepts beyond the level on fresh positioning |
The Mirra AI panel reads these alongside value, structure and delta, and every read names the level that would invalidate it. Probabilities are clamped, so no read is allowed to imply certainty. If you follow a list of stocks as well as the indices, the Order Flow Scanner carries OI columns (OiDelta, OiBarClass, OiSessionPct) and the Market Profile Scanner ranks symbols by session OI change, buildup class and OI-POC.
An intraday open interest checklist
Run this on Nifty and Bank Nifty futures through the session. It takes a minute at each step and keeps OI in its proper role: a filter that stops bad trades.
- Before 9:15 AM IST: mark yesterday’s VAH, VAL, POC and any naked POC or OI-POC still untested. Check whether you are inside expiry week, where rollover distorts OI.
- First hour (initial balance): note the buildup label forming. Is the opening move long buildup, short buildup, or covering from yesterday’s positions?
- At every test of the day’s high: check the last few bars’ OI labels. Falling OI into the high is Warning 1 — do not chase.
- After a morning trend: watch for long-liquidation bars clustering near the high and the unwind share rising. That is Warning 2, often before price drops.
- At support: ask whether OI is rising into the level (short buildup, Warning 3) or falling (sellers leaving). Only consider buying support in the second case.
- At VAH, VAL and the OI-POC: read the OI label at the level, not in the middle of the range (Warning 4).
- Before every trade: write down what would prove you wrong — the OI change and the price that would flip the read. If you cannot name it, skip the trade.
- After the close: compare the session buildup label with how the day actually ended. Over a few weeks this shows which readings matter most on your instrument.
If you want to see these readings on a live chart, the free weekly MirraCharts webinars walk through Market Profile and Order Flow on NinjaTrader 8 with the team that builds them. For the related signals, see early warning signs in Market Profile and footprint reversal signals, and the glossary for any term in this post.
Frequently asked
Is falling OI during a rally always bearish?
No. It means shorts are covering, so the rally lacks new buyers. It becomes a warning only if price stalls and OI keeps falling; if OI turns up while price holds, new longs have joined.
Which timeframe is best for intraday OI analysis on Nifty?
OI arrives in snapshots, so single 1-minute bars are noisy. Read clusters of bars on 3- to 15-minute charts alongside the session total.
Why does Nifty open interest drop near expiry?
Traders roll positions from the expiring contract to the next month, so near-month OI falls. Treat falling OI in expiry week with caution before calling it long unwinding.
Do I need a special data feed for OI in Mirra?
Yes. Mirra’s OI features read live open interest through an Accelpix Pix Connect feed inside NinjaTrader 8. Without it, the OI layers have nothing to read.
Can open interest predict a fall?
No indicator predicts with certainty. OI shows whether money is arriving or leaving, which raises or lowers the odds of a move; always pair the read with the price that would prove it wrong.
Educational content only — not investment advice. Examples are illustrative. Trading in securities, derivatives, crypto and forex involves substantial risk of loss.