What a footprint chart actually shows
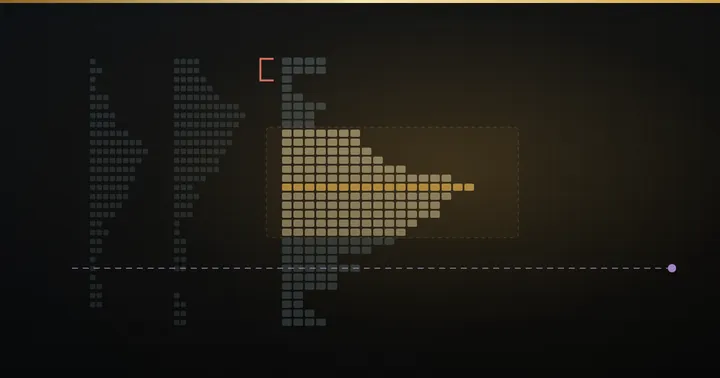
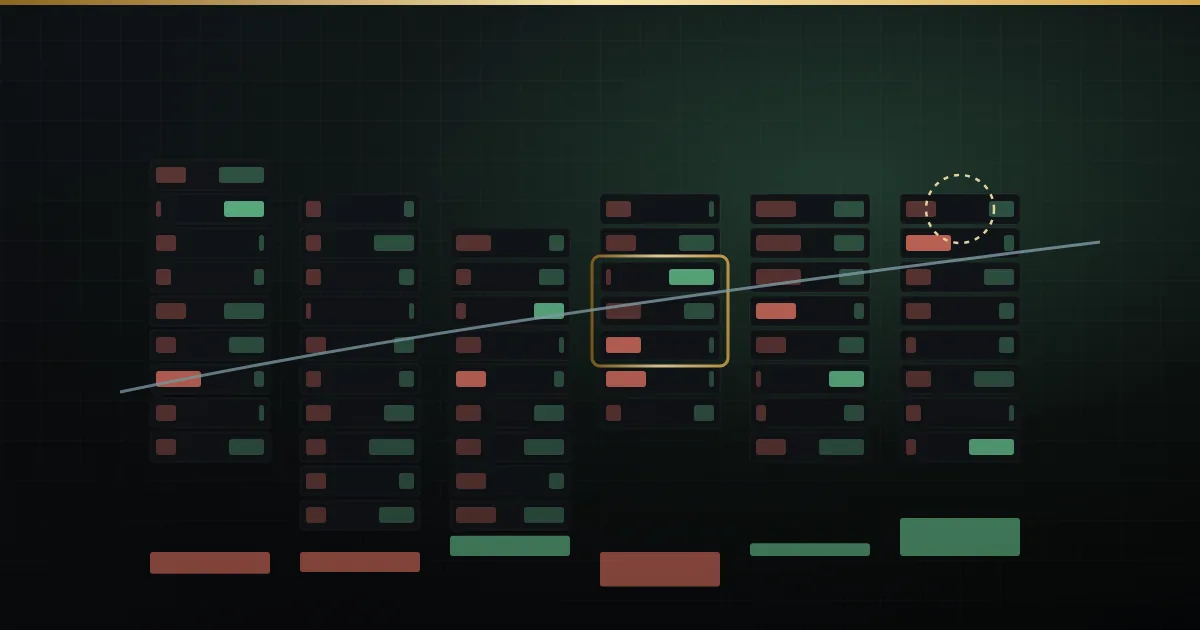
A candle tells you four prices: open, high, low and close. A footprint chart opens the candle up and shows the trades inside it. At every price in the bar you see two numbers: volume that traded on the bid (sellers hitting buyers) and volume that traded on the ask (buyers lifting sellers). That is the bid ask volume ladder.
Three ideas carry the rest of this article:
- Delta is ask volume minus bid volume for a bar. Positive delta means aggressive buyers were more active; negative means aggressive sellers were.
- Cumulative delta adds each bar’s delta through the session, so you see whether aggression has been building or fading.
- Imbalance is when one side heavily outweighs the other at neighbouring prices, compared diagonally (ask at one price against bid one row below).
Why does this matter for reversals? Because price is the result, and flow is the cause. Before a Nifty or Bank Nifty futures move turns, the effort behind it usually stops producing results. The footprint is where that mismatch shows up first. Order flow trading is simply the habit of reading that mismatch instead of waiting for the candle to confirm it.
Signal 1: Absorption at a high or low
Absorption means aggressive orders keep hitting one side, but price will not move, because a large passive order (a resting limit order) is soaking them up. It is high effort with no result.
Illustrative example: say Nifty futures rally from 24,180 to 24,262 in the first hour. At 24,260–24,262 the footprint shows heavy ask volume, three bars in a row, yet each bar closes at or below 24,262. Buyers are spending, and a seller is quietly filling them. If that seller holds, the buyers who paid 24,260 are now the weak hands.
What makes absorption more meaningful:
- It happens at a level that matters, such as the previous day’s high, a value area edge or a round number.
- It repeats over two or more bars rather than appearing once.
- The next bar cannot make a new high and delta starts to turn.
In Mirra Advanced Order Flow, absorption is graded, ringed on the bar as it happens, and scored into the AI read with an evidence line.
Signal 2: Delta divergence
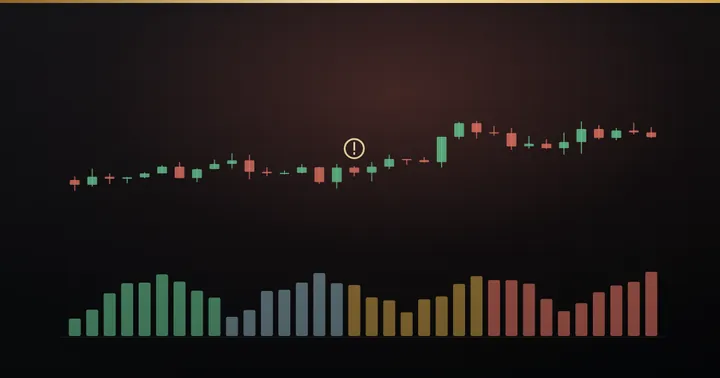
Delta divergence is when price makes a new high but delta does not (or price makes a new low but selling delta does not). It says the push to the new extreme needed less aggression than the push before it.
Illustrative example: Bank Nifty futures make a high at 52,140 on a bar with delta of +1,800. Twenty minutes later price pokes to 52,165, but that bar’s delta is only +400 and cumulative delta is flat. Price went higher; buying pressure did not.
Two versions are worth tracking:
- Bar delta divergence: the delta on the new-high bar is weaker than on the earlier high.
- Cumulative delta divergence: the session’s cumulative delta makes a lower high while price makes a higher high. This is slower but often more reliable.
Mirra Advanced Order Flow plots delta, max and min delta, buy/sell percentage and cumulative delta with its own strip, and divergence is one of the things it reads. The scanner carries separate DeltaDivergence and CumDeltaDivergence columns, so you can see which symbols on your list are diverging without opening every chart.
Signal 3: Exhaustion and trapped traders
Exhaustion is the opposite of absorption. Instead of heavy volume failing to move price, volume simply dries up at the extreme. The last buyers at the top print small numbers; there is nobody left to push.
Trapped traders are the people who bought the high (or sold the low) just before price turned. If price moves back below their entry, they are underwater. Their exits, which are sell orders, can fuel the reversal.
Illustrative example: an F&O stock future breaks above 1,412 with strong positive delta, then the next two bars close back at 1,405. Everyone who bought between 1,410 and 1,414 is trapped. If price stays below 1,410, their stops sit just under the breakout candle.
Mirra marks trapped traders with their cost basis: the live long and short average entry, with the size sitting offside. The pain map shows where longs and shorts were built and how far underwater they are. That turns “someone is probably trapped” into a price and a quantity you can see.
Signal 4: Stacked imbalances that fail
A stacked imbalance is three or more imbalances in a row on the same side. Buy-side stacks often mark the aggression that started a move up, and that zone tends to act as support on a retest.
The reversal clue is when that support fails. If price comes back into a buy-side stacked imbalance zone and trades straight through it, with sellers now dominating, the aggression that built the move has been undone.
Illustrative example: Nifty futures show a buy-side stack at 24,205–24,212 during the morning push. After lunch, price returns, prints heavy bid volume through 24,205 and closes the bar at 24,198. The morning buyers’ zone has been reclaimed by sellers.
Mirra highlights stacked runs at your own imbalance ratio and minimum volume. Unfilled imbalance zones are scored by age and retests, and dim as they weaken, so a zone already tested three times does not look as strong as a fresh one. A failure of a fresh, strong zone tells you more than a failure of a stale one.
Signal 5: Big trades at the extremes
A single large print at the very top or bottom of a move is worth noticing. It may be a large participant taking profit, opening a position against the move, or absorbing the last of the crowd.
Context decides which. A big sell print at the session high followed by lower prices is useful. One taken out by higher prices minutes later says the large seller was wrong.
Mirra rings prints above your chosen threshold on the side they hit, so one large order is not lost in the noise. Pair it with Open Interest: Delta × ΔOI classification labels each bar as new longs, short covering, new shorts or long liquidation. A rally made of short covering rather than new longs is one of the cleanest early warnings that the fuel will run out. OI features need an Accelpix Pix Connect feed.
Context: cumulative delta, VWAP and the level
The same footprint pattern means different things in different places. Three filters keep you honest:
- Cumulative delta trend. If cumulative delta has been rising all session and only now flattens, a reversal signal is a pause candidate. If it has already rolled over, the signal has company.
- VWAP. The volume-weighted average price is where the average participant of the day stands. A reversal signal far above VWAP has room to travel back; one sitting right on VWAP often just chops.
- The level. Signals at a prior high, a value area edge or a naked POC carry more weight. The Market Profile early-warning signs help you find those levels before the session starts.
| Signal | What you see | What it suggests | What would prove it wrong |
|---|---|---|---|
| Absorption | Heavy aggression at a level, price stuck | A passive order is defending the level | Price breaks the level with follow-through |
| Delta divergence | New price extreme, weaker delta | Aggression is fading | Delta expands again on the next push |
| Exhaustion / traps | Thin volume at the extreme, quick rejection | No one left to push; late entries stuck | Price reclaims the trapped traders’ entry |
| Failed stacked imbalance | Price trades through a stack against it | The move’s origin has been undone | Price recovers back above the zone |
| Big trade at extreme | Large print at the high or low | A large player may be leaning against the move | The big print’s price is taken out |
What would prove it wrong, in one line: if price trades through the level where the signal formed, with delta expanding in the direction of the original move, the reversal idea is dead. Exit or stand aside; do not argue with the tape. Every Mirra AI read names its own invalidation, and its confidence is capped so no panel implies certainty.
A step-by-step routine for confirming a reversal
Use this checklist on a footprint chart for NSE futures during the 9:15 AM to 3:30 PM IST session:
- Mark your levels before 9:15. Previous high and low, value area edges, any naked POC. Only look for reversals there.
- Wait for the move to reach a level. No level, no reversal trade.
- Look for at least two of the five signals. For example, absorption plus delta divergence, or a failed stack plus trapped traders.
- Check cumulative delta and VWAP. Is session aggression flattening? Is there room back toward VWAP?
- Check Open Interest. Is the move on new positions or on covering? Covering is weaker fuel.
- Define the invalidation. Usually just beyond the extreme or the absorption price. If the stop is too far for your size, skip the trade.
- Wait for the first confirming bar. A bar that closes back inside, with delta flipping, is your trigger, not the signal itself.
- Size small and review. Note which signals were present and whether the move followed. Your own notes are the only statistics that count.
In Mirra, the AI panel can do part of this reading for you in five voices, from Simple to Pro. The Coach mode is especially useful here, because it says WAIT — NO TRADE when that is the honest answer. The panel rebuilds on live ticks every few seconds, not only at bar close.
When to stand aside
- The first few minutes after the open, when the footprint is noisy and spreads are wider.
- Around major scheduled events such as RBI policy or big global data.
- On clear trend days where every signal keeps getting overrun.
- When the order flow is one-sided and thin. Mirra’s VPIN and Kyle’s lambda readings flag a toxic tape and how far price moves per thousand lots, which is a reason to cut size or wait.
If you follow several symbols, the Order Flow Scanner runs the same engine across your Market Analyzer watchlist with columns for absorption, trapped traders, exhaustion, stacked imbalances, big trades and footprint reversals, plus alerts that are off until you switch them on. The scanner watchlist guide shows how to set it up. For the chart settings, see the Order Flow Charts docs, and the glossary for any term here.
Want to see these signals on a live chart? Join one of our free weekly webinars, or try Mirra Advanced Order Flow with the free 5-day trial on NinjaTrader 8 and check pricing when you are ready.
Frequently asked
What is a footprint chart in order flow trading?
A footprint chart shows the volume traded on the bid and on the ask at every price inside each bar. It lets you see delta, imbalances and absorption that a normal candle hides.
What is delta divergence?
Delta divergence is when price makes a new high or low but delta does not confirm it. It suggests the aggression behind the move is fading, though in strong trends it can persist for a long time.
Can footprint charts be used for NSE futures like Nifty and Bank Nifty?
Yes. Mirra Advanced Order Flow runs on NinjaTrader 8 with Accelpix data and renders the bid × ask footprint for Nifty, Bank Nifty and F&O stock futures.
Does absorption always mean a reversal?
No. Absorption shows a passive order defending a level, but that order can be exhausted and the level can break. Treat it as a warning and define where you are wrong, usually just beyond the absorption price.
Does Mirra AI tell me when to trade?
Mirra AI gives a plain-English read of who is in control, what to do and what would prove it wrong. Its confidence is capped, and in Coach mode it says WAIT — NO TRADE when the tape does not justify a trade.
Educational content only — not investment advice. Examples are illustrative. Trading in securities, derivatives, crypto and forex involves substantial risk of loss.