How to read a Market Profile chart in five minutes
A candlestick chart tells you where price went. A Market Profile chart tells you where the market spent its time and did its business.
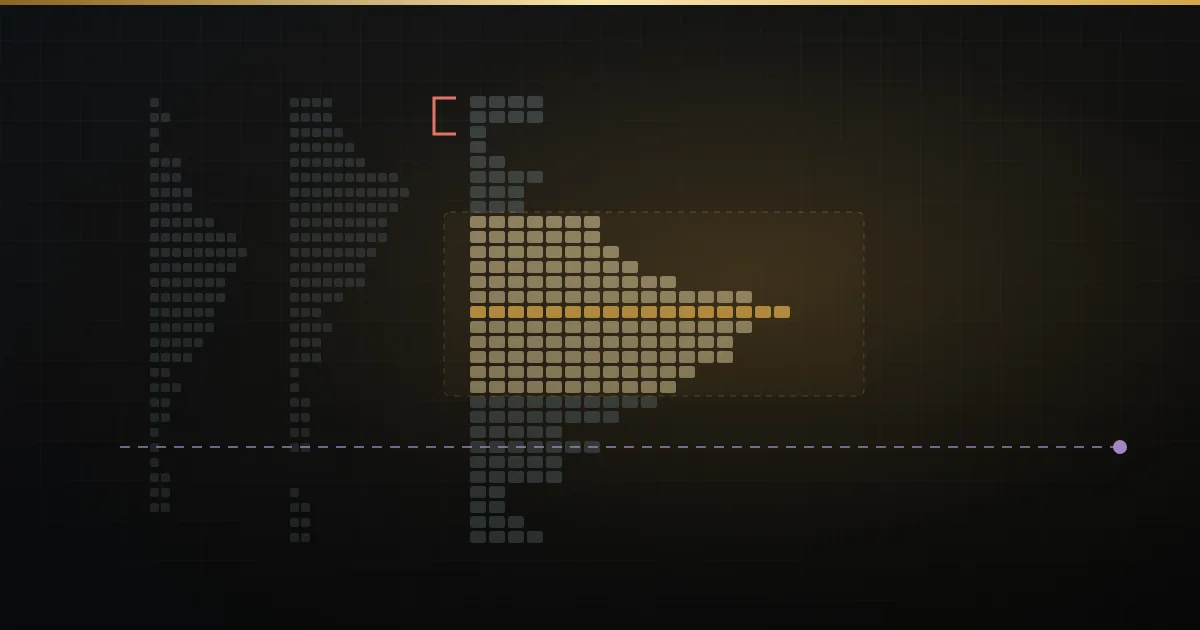
The profile is drawn with TPOs (Time Price Opportunities). Each 30-minute period of the session gets a letter, and that letter is printed at every price traded during that period. On NSE, a Nifty futures session from 9:15 to 15:30 IST gives you about thirteen of these periods.
Four terms do most of the work:
- Point of control (POC) — the price with the most TPOs (or the most volume, on a volume profile). It is the fairest price of the day: where buyers and sellers agreed most.
- Value area — the band around the POC holding roughly 70% of the session’s activity. Its top is the VAH (value area high), its bottom the VAL (value area low).
- Initial balance (IB) — the range of the first hour, which on NSE means 9:15 to 10:15.
- Range extension — any trade beyond the IB. It means a bigger, later participant has stepped in.
The core idea behind all of this is auction market theory: the market moves to find a price where trade happens, and it keeps moving until one side stops showing up. When an auction is unfinished, lopsided or rejected, the profile shows it. Those are the early warnings. New to a term? The glossary explains each one.
Signs 1 and 2: Poor highs, poor lows and single prints
Poor highs and poor lows
A healthy auction ends with a tail: a few single TPOs at the extreme, showing price probed, found no more buyers (at a high) or sellers (at a low), and got rejected quickly. A poor high or poor low is the opposite — a flat, blunt extreme with two or more TPOs sitting at the same top or bottom price and no tail.
That flatness says the auction stopped, not that it finished. So a poor high above today’s value is a warning to anyone short near it: price may return to take it out.
It also cuts the other way. Say Nifty futures clear yesterday’s high at 24,310 (an illustrative number), and the high they leave is poor. That is often a stalled auction, not a real breakout. Price can rotate straight back into value.
Single prints
Single prints are a run of prices where only one TPO letter traded. They mark fast, one-way movement — one side was so aggressive that nobody had time to trade back and forth. Single prints in the middle of a profile act as a dividing line. If price returns to them and holds, the aggressive side is still in charge. If price slices back through them, the original move has lost its sponsor.
Sign 3: Value migration
Price can wander. Value is harder to fake. Value migration is the day-by-day shift of the value area. When each session’s value area sits higher than the last, buyers are accepting higher prices — a trending condition. When value areas overlap heavily day after day, the market is in balance (a range), and a breakout is building pressure.
The early warning is a change in that pattern. Say Bank Nifty has printed three overlapping value areas, and today’s value starts forming above yesterday’s VAH by mid-session. The market is quietly agreeing on a higher price, often before the obvious breakout candle.
The reverse is just as useful. If price makes a new high but value forms lower or overlapping, the rally is being made by a few aggressive trades while most business still happens below.
Sign 4: IB extensions and a day type that changes mid-session
Profile traders sort sessions into day types. A Normal Variation day extends the IB modestly in one direction. A Neutral day extends on both sides; a Neutral Extreme closes near one end. A Double Distribution day builds two separate value areas with a thin band between them. A trend day keeps extending one way, with a thin, one-sided profile.
The warning is in the change. At 10:15 the session may look like a normal, rotating day. By 11:30 price has extended the IB by 1.5 times and is building a second cluster of TPOs above the first. The day is turning into a Double Distribution or trend day, and strategies built for rotation — fading the edges — stop working.
A move of 1.5× the IB is a range extension day developing; 2× and 3× are the levels traders watch for trend continuation or exhaustion.
Sign 5: Naked POC magnets
A naked POC (also called a virgin POC) is a previous session’s point of control that price has not traded back to since. Because the POC was the day’s fairest price, an untested one often acts like a magnet. Price tends to drift back to it, especially in a quiet session with no strong new information.
This matters most when you are holding a winner. Say you are long Nifty futures from 24,180 and price is at 24,260. There is a naked POC from three sessions ago at 24,140, just below your entry. If momentum slows, that level is a reasonable place for price to be pulled toward — and the reason winners turn into losers. Knowing it exists lets you decide in advance whether to trail a stop or book part.
Age and distance both matter. A naked POC a few points away is more relevant today than one far below from many weeks ago.
Sign 6: Leaving value — and failing to be accepted
When price moves outside the value area, the market is testing a new price. Two things can happen. Either the new price is accepted — time builds there, TPOs stack up over two or more periods, and value starts to form outside the old range — or it is rejected, and price returns into value.
Failure to be accepted is one of the clearest early warnings in the profile. A well-known rule of thumb, often called the 80% rule, says that when price opens outside the prior value area, re-enters it, and holds inside for two consecutive 30-minute periods, the odds of it travelling to the other side of value rise noticeably. It is a probability guide, not a law.
Illustrative example: Nifty futures open at 24,180, above yesterday’s VAH of 24,150. The first period trades up to 24,215, but the second drops back to 24,140 and the third holds inside value. The market tried higher prices and found no takers. The read shifts toward a rotation down to yesterday’s POC and possibly the VAL.
What would prove it wrong
Every one of these signs needs a level that cancels it. In the example above, the “failed acceptance” read is wrong if price climbs back above 24,150 and builds TPOs there for two periods — the market has accepted higher prices after all. A poor-high warning is cancelled once the high is cleanly taken out with a tail left above it. A single-print read is cancelled when price slices through the singles and holds on the other side. If you cannot name the level, you do not have a setup.
How Mirra Advanced Market Profile marks these signs
Mirra Advanced Market Profile & TPO runs on NinjaTrader 8 with live data from Accelpix, and draws each of these structures on the chart as it forms.
| Sign | What it warns | How Mirra shows it |
|---|---|---|
| Poor high / poor low | Unfinished auction; price may return | Labelled as they form |
| Single prints | Aggressive one-way move; a line to defend | Singles marked on the profile |
| Value migration | Market accepting a new price level | VAH, POC and VAL per session; value-area overlap column in the scanner |
| IB extension / day type | Rotation day turning into a trend day | IB with ×1.5, ×2, ×3 extensions; day type called live |
| Naked POC | Untested level pulling price back | Carried forward with age and distance |
| Failed acceptance | Rejection; rotation back through value | Value area and POC; Pro voice covers 80%-rule risk |
Day types are classified with odds — Normal Variation, Double Distribution, Neutral Extreme, trend and more — with a card per session showing volume, delta, range, value area and IB. A live stats card adds day odds for trend versus rotation. Value area and POC use a deterministic tie-break, so the level the chart shows is the same level the scanner and the AI use. Settings are in the Market Profile & TPO tutorial.
Mirra AI then reads the profile and writes a plain-English read: who is in control, the plan, and the level that would prove it wrong. You choose one of five voices — Simple, Beginner, Coach, Debate or Pro. The answer stays the same; only the language changes. The Coach voice will say “WAIT — NO TRADE” when that is the honest answer, and probabilities are clamped so no read implies certainty. With an Accelpix Pix Connect feed, the read also includes Open Interest behind the auction — whether a move is fresh positioning or just churn. Our guide on reading open interest intraday covers that side in depth.
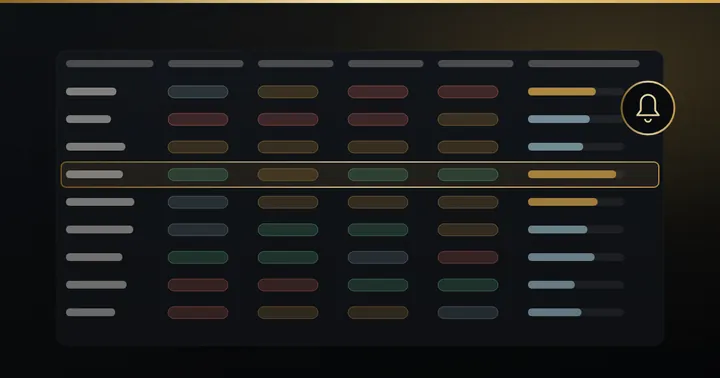
The included Market Profile Scanner runs the same engine across your watchlist, with columns for day type, IB break and range extension, value-area overlap, multi-day magnets and auction-quality flags for singles, poor highs and poor lows.
A pre-market and first-hour routine
A simple daily routine for Nifty, Bank Nifty or an F&O stock:
- Before 9:15 — mark yesterday. Note the prior VAH, POC and VAL, the day type, and any poor high, poor low or single prints left behind.
- List the magnets. Write down naked POCs within a reasonable distance above and below, with how many sessions old they are.
- Check value migration. Are the last three value areas rising, falling or overlapping? That sets your bias: trend or balance.
- Note the open. Is price opening inside, above or below yesterday’s value? Outside value means acceptance is the first question of the day.
- 9:15–10:15 — watch the IB build. A narrow IB leaves room for range extension; a very wide one often means rotation inside it.
- After 10:15 — mark the extensions. Note where 1.5× and 2× the IB sit, and watch whether price reaches them and whether the day type is changing.
- Before any trade — name the invalidation. Write the one level that proves your read wrong. No level, no trade.
If you want to cross-check a profile signal with the tape, the footprint shows who is trapped at the same levels — see order flow reversal signals. To watch this routine done live on NinjaTrader charts, join one of our free weekly webinars. When you are ready, you can try the indicator on a free 5-day trial from the pricing page.
Frequently asked
What is the difference between a TPO chart and a volume profile?
A TPO chart counts time: how many 30-minute periods traded at each price. A volume profile counts contracts traded at each price. Both show value and a POC, and they usually agree; where they differ, it tells you whether time or size dominated that level.
What is a poor high in Market Profile?
A poor high is a flat top with two or more TPOs at the same highest price and no tail. It suggests the auction stopped rather than finished, so price often returns to it. It stops being a warning once the high is cleanly taken out with a tail left above.
Why does price return to a naked POC?
A POC is the price where the most business was done in a session, so it acts as a fair-value reference. When it has not been retested, price is often drawn back to it, especially in quiet sessions. It is a tendency, not a certainty.
What is the initial balance on NSE?
The initial balance is the range of the first hour of trade, 9:15 to 10:15 IST for NSE index and stock futures. Moves beyond it, measured in multiples such as 1.5× or 2× the IB, help you judge whether the day is rotating or trending.
Does Market Profile predict where Nifty will go?
No. It shows where the auction is balanced, unfinished or being rejected, which shifts the odds. Every read should come with a level that would prove it wrong, and Mirra AI names that level in each read.
Educational content only — not investment advice. Examples are illustrative. Trading in securities, derivatives, crypto and forex involves substantial risk of loss.