What Elliott Wave theory actually says
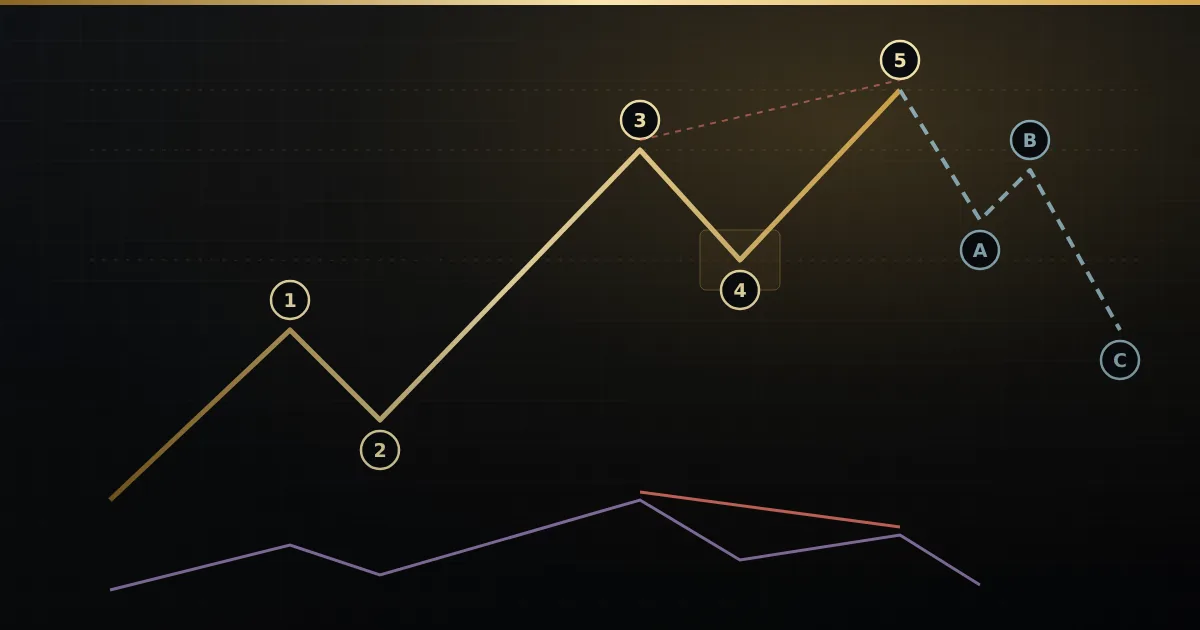
Elliott Wave theory is a way of reading trends as a repeating rhythm of crowd behaviour. Ralph Nelson Elliott noticed in the 1930s that markets tend to trend in five steps and correct in three. The five-step move is called an impulse (waves 1, 2, 3, 4, 5). The three-step move against it is called a correction (waves A, B, C).
Inside an impulse, waves 1, 3 and 5 push with the trend and waves 2 and 4 pause against it. Wave 3 is usually the strongest leg. Wave 5 is often where late buyers join as early buyers book profit. That is why wave 5 matters so much for this series: it is where a trend most often starts running out of road.
Waves also come in degrees. A five-wave move on a 15-minute Nifty chart can be just wave 3 of a larger move on the 60-minute chart. Reading two degrees at once stops you mistaking a small pullback for a top, or a top for a small pullback.
The three Elliott Wave rules that cannot bend
Most of Elliott Wave is guidelines. Only three things are hard Elliott Wave rules; if one breaks, the count is wrong.
- Wave 2 never retraces all of wave 1. If price falls below the start of wave 1, there was no wave 1.
- Wave 3 is never the shortest of the three trend waves (1, 3 and 5).
- Wave 4 does not overlap wave 1. In a normal impulse, the low of wave 4 (in an uptrend) stays above the high of wave 1.
Each rule creates a price. Rule 1 gives an invalidation level during wave 2, rule 2 caps wave 5 if wave 3 was short, and rule 3 gives a hard floor during wave 4. A count that cannot name such a price is not yet tradeable.
Why hand-drawn counts fail so often
Ask two analysts to count the same Nifty chart and you often get two answers. The process, not the theory, is usually the problem.
- Bias. You already like a long trade, so the chart “becomes” a wave 3. The count bends to fit the position, and the rules get broken quietly.
- Redrawing. When price goes the wrong way, the labels are moved instead of the stop. A count that is redrawn every day has no invalidation, so it can never be wrong — and so it never helps.
- Wrong wave, right shape. A strong fifth wave looks like a third wave in real time, and buying it makes you the last buyer before the correction.
The fix: check every count against the rules, write down the price that kills it, and keep an alternate count ready.
Wave 5 exhaustion: the early-warning signs
No single signal marks the end of a trend. You look for several independent signs lining up near the same price.
1. Momentum divergence on the oscillator
The classic Elliott oscillator is the difference between a 5-period and a 35-period moving average. In a healthy impulse it peaks in wave 3. When price makes a new high in wave 5 but the oscillator makes a lower peak, that is wave 5 divergence: price is still rising, but the push behind it is weaker than it was in wave 3.
2. Fibonacci target zones
Wave 5 often ends near common Fibonacci relationships: wave 5 equal to wave 1, or wave 5 at 0.618 of wave 1. Where projections from different waves agree, you get a cluster zone.
3. Overlap and wedge warnings
When the sub-waves of a fifth wave start overlapping each other and the move narrows into a wedge, buyers are struggling to make progress. In Elliott terms this is often an ending diagonal, often followed by a sharp move back to where the wedge began.
4. Positioning behind the leg
Open interest (OI) is the number of futures or options contracts still open. A rally on rising OI is fresh money committing (long buildup). The same rally on falling OI is short sellers buying back (short covering) — a move that tends to run out once the covering is done. A fifth wave on falling OI is a warning worth noting. See our Nifty open interest guide for the four OI states.
| Sign | Healthy wave 3 | Tired wave 5 |
|---|---|---|
| Oscillator | Makes its highest peak | Lower peak while price makes a higher high |
| Structure | Clean, fast, little overlap | Overlapping swings, narrowing wedge |
| Fibonacci | Often extends past 1.618× wave 1 | Arrives in a cluster zone (e.g. equal to wave 1) |
| Open interest | Rising with price (long buildup) | Falling with price rising (short covering) |
| What would prove it wrong | A break below wave 1’s high | A strong close above the target zone with momentum making a new high |
What an ABC correction looks like
After a five-wave impulse, the market usually corrects in three legs. Wave A is the first drop, and most people treat it as a normal dip. Wave B is a bounce that traps late buyers, because it looks like the trend resuming. Wave C is the final leg down, often roughly equal in length to wave A, and it frequently ends near the area of the previous wave 4.
The common mistake in an ABC correction is buying wave A’s low: the first dip is only one-third of the job.
For wave 4 corrections, depth matters. Measured as a Fibonacci retracement of wave 3, a pullback of 24–38% is the healthy range, 38–50% is a caution range, and 50–62% is close to the point where the impulse count starts to look doubtful.
The invalidation price: turning a count into a plan
Worked example (all prices illustrative): say Nifty futures on the 60-minute chart rise from 23,600 to 24,000 (wave 1, 400 points), dip to 23,800 (wave 2), then run to 24,650 (wave 3, 850 points). Wave 4 pulls back to 24,420 — about 27% of wave 3, inside the healthy range.
- Invalidation for the bullish count: 24,000, the top of wave 1. If wave 4 trades below it, rule 3 is broken and the impulse count is dead.
- Wave 5 target zone: wave 5 at 0.618 of wave 1 gives about 24,667; wave 5 equal to wave 1 gives 24,820. The zone to watch is roughly 24,670–24,820.
- Rule 2 ceiling check: wave 3 (850) is longer than wave 1 (400), so wave 5 is not capped by the “wave 3 never shortest” rule here.
Now say price reaches 24,790. The oscillator peak is lower than it was at 24,650. OI is falling as price rises. Three independent signs point the same way: the fifth wave looks tired.
What would prove it wrong: a strong close above 24,820 with the oscillator making a new high and OI rising again. That suggests an extended fifth, or a count off by one degree. A bearish trader keeps a stop above the wave 5 high and steps aside rather than redrawing labels.
If the top holds, an ABC might run A to 24,450, B to 24,640 and C near 24,300, around the old wave 4 area. Those are possibilities to prepare for, not forecasts.
How Mirra Master Elliott Wave checks the count for you
Mirra Master Elliott Wave is a NinjaTrader 8 indicator built to remove the three habits above. It counts the impulse (1–5) and the correction (A–B–C) on two degrees, a minor and a major, and checks every count against the hard rules. If wave 2 retraces all of wave 1, wave 3 is the shortest, or wave 4 overlaps wave 1, the count is rejected.
- Exhaustion warnings: the 5/35 Elliott Oscillator is drawn as a strip inside the chart with wave 5 divergence marked. The Profit-Taking Index (PTI) above 35 favours a fifth wave still to come; below 35 it warns the trend may already be done. A Make-or-Break zone marks where wave 5 should terminate.
- Fibonacci targets: Wave Price Targets print cluster zones where wave 3, wave 5 or wave C should run out, and a target matrix on the right edge shows where projections from different waves agree.
- Wave 4 zones: green 24–38%, amber 38–50% and red 50–62% retracement zones, plus three wave 4 channels and a price-and-time ellipse for the end of wave 4.
- Graded setups: ten mechanical setups — including Type 1 (end of wave 4), Type 2 (wave 5 exhaustion) and TS1–TS4 (end of an A-B-C) — each drawn with entry, stop, T1 and T2. Every setup is graded A+, A or B on nine factors, with a probability held between 15% and 85%.
- OI on each leg: long buildup, short buildup, short covering or long unwinding behind every leg, with session OI change and OI velocity, through the Accelpix feed.
- Mirra Memory: every completed wave and setup outcome is logged per instrument, so the panel quotes hit rates from your own instrument rather than textbook ones.
The Mirra AI panel explains the same wave state in five voices, from Simple to Pro, and every voice ends with an invalidation level. Wave confidence is held between 12% and 88% — never certain — and the panel ends with “decision support only, not advice”. The indicator and the Elliott Wave scanner are free for every Accelpix subscriber. Settings are in the Elliott Wave docs; files are on downloads.
A routine for using a count without forcing it
A pre-trade routine for how to count Elliott waves honestly, with an Elliott Wave indicator or a pencil.
- Start on the higher degree. On the 60-minute or daily chart, decide: impulse or correction?
- Check the three rules. If any rule is broken, drop the count. Do not adjust it to save a trade idea.
- Write down the invalidation price. Before any order, note the level that kills the count. That level, or just beyond it, is your stop area.
- Keep one alternate count. Ask “if my count is wrong, what is the next most likely one?” and note what price would switch you to it.
- Mark the target zone in advance. Draw the Fibonacci cluster for wave 5 or wave C before price gets there, not after.
- Wait for two or more signs. One sign is a note; several together are a warning.
- Size from the stop. Decide the rupee risk first (for example ₹2,000 on one Nifty lot), then let the distance to the stop decide whether the trade fits.
- Review the outcome. Log whether the count held; your own record beats any textbook.
If you want to see wave counts worked through live, the free weekly MirraCharts webinars cover the indicators on real NinjaTrader charts. Compare this with the Market Profile early-warning signs and the order flow reversal signals in this series, or browse all Mirra indicators.
Frequently asked
What are the three hard rules of Elliott Wave theory?
Wave 2 never retraces all of wave 1, wave 3 is never the shortest of waves 1, 3 and 5, and wave 4 does not overlap wave 1 in a normal impulse. If any of these breaks, the count is wrong and should be dropped.
What is wave 5 divergence?
It is when price makes a new high in wave 5 but a momentum oscillator, such as the 5/35 Elliott Oscillator, makes a lower peak than it did in wave 3. It warns that the push behind the trend is weakening; it is a warning, not a sell signal on its own.
How do I know an ABC correction is finished?
You usually can’t know for certain. Wait for three legs, with wave C reaching a Fibonacci zone you marked in advance (often near wave A’s length or the old wave 4 area), and keep a stop beyond the end of C.
Does Elliott Wave work on Nifty and Bank Nifty?
The same rules apply to Nifty and Bank Nifty futures as to any liquid market. Use two timeframes, write down the invalidation price, and treat every count as a probability, not a forecast.
Is Mirra Master Elliott Wave free?
Mirra Master Elliott Wave and its scanner are free for every Accelpix subscriber, and run on NinjaTrader 8. See the downloads and pricing pages for details.
Educational content only — not investment advice. Examples are illustrative. Trading in securities, derivatives, crypto and forex involves substantial risk of loss.