Why scanning beats flipping charts
Picture a normal morning. You have a list of F&O stocks plus Nifty and Bank Nifty futures. You open chart one, then chart two, then chart three. By the time you reach chart fifteen, the stock that set up at 9:40 has already moved, and you saw it only after the fact.
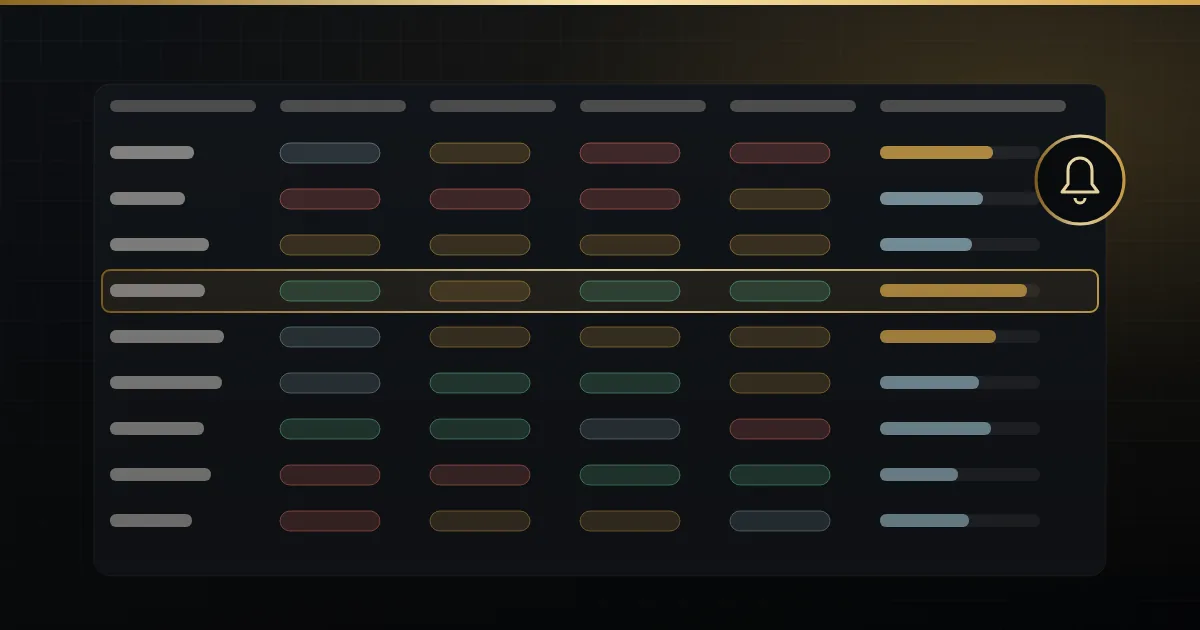
That is not a discipline problem. It is a bandwidth problem. One pair of eyes can read one chart properly at a time. A stock scanner flips the order of work: instead of you visiting every chart, every chart reports to you as a row of numbers, and you sort the rows.
The point is not to trade from the grid. The point is to build an early-warning watchlist — the two or three symbols whose structure, order flow or positioning has started to change before price makes the obvious move. Then you open those charts, and only those.
The three Mirra scanners in NinjaTrader Market Analyzer
MirraCharts ships a scanner with each of its three main indicators. All three run inside the NinjaTrader Market Analyzer — NinjaTrader 8’s grid window where each row is an instrument and each column is a value you choose. Each scanner runs the same engine as its chart indicator, so a level in the grid is the level on the chart.
| Scanner | What it reads | Sort first by | Early warning it gives |
|---|---|---|---|
| Market Profile Scanner | Auction structure and OI commitment, 45 metrics | MirraScore | Value migrating, IB breaks, poor highs and lows, untested magnets |
| Order Flow Scanner | Tick-level aggression and OI per bar | AiScore | Absorption, trapped traders, exhaustion, delta divergence, sweeps |
| Elliott Wave Scanner | The same rule-checked wave engine as the indicator | Your own rules on the wave output | Symbols whose count is near a decision point |
The Market Profile and Order Flow scanners are included with those indicators, and both are built to run across 100+ symbols. The Elliott Wave indicator and its scanner are free for every Accelpix subscriber. Live data, including Open Interest (OI), comes through the Accelpix feed — the OI columns need an Accelpix Pix Connect feed.
Market Profile columns that flag a stock early
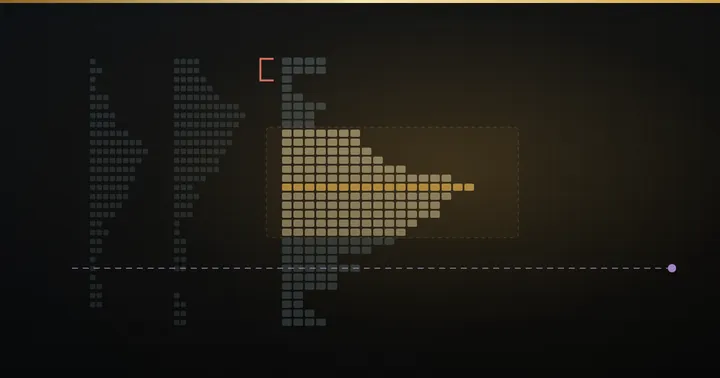
Market Profile organises the day by price and time to show where trade was accepted (value) and where it was rejected. The Market Profile Scanner turns that structure into sortable columns. These are the ones that tend to change first:
- MirraScore and Signal. One signed number per symbol. Positive means the auction leans up, negative means down, and the size tells you how strongly. A stock whose score flips sign is worth a look before its candle chart shows anything dramatic.
- Readiness. New in the October 2026 release: the chart’s Buy/Sell readiness score, ranked across your list.
- Price vs POC and range position. The POC (point of control) is the price with the most trade. This column shows how far price sits from value, in ticks and as a percentage — stretched or sitting in balance.
- Value-area overlap. How much today’s value area overlaps yesterday’s. Heavy overlap means balance; little overlap means value is migrating, which often comes before a trend.
- IB break and range extension. The initial balance (IB) is the first hour’s range. This shows which symbols broke it, and by how many IB multiples.
- Multi-day magnets. Untested POCs and unfilled gaps that tend to pull price back.
- Auction quality flags. Singles, poor highs and poor lows. A poor high is an auction that ended without a proper tail — unfinished business that often traps breakout buyers.
Two practical notes. First, match the ten settings listed in the scanner’s feature guide to your chart; when they match, the scanner reproduces your chart exactly, and when they do not, the two will disagree. Second, there is a structure and data health column that tells you when a symbol’s data cannot be trusted. Check it before believing any other number on that row. More in our Market Profile early-warning post.
Order flow columns that show the turn forming
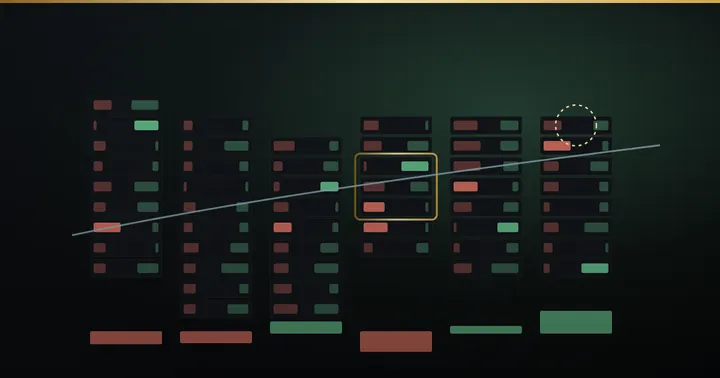
Order flow is the record of who hit whom: buyers lifting the offer or sellers hitting the bid. Delta is buying volume minus selling volume. The Order Flow Scanner runs the Mirra tick engine across your list and adds a composite signal from STRONG BUY to STRONG SELL, a staged setup tracker and the last event with a timestamp.
- AiScore. One signed number per symbol: positive means buyers are in control, negative means sellers.
- Delta, CumDelta, DeltaPercent and UtDtRatio. Today’s aggression, whether it has been building or fading, and the uptick/downtick ratio.
- DeltaDivergence and CumDeltaDivergence. Price makes a new high but delta does not follow — a classic early sign that the push is losing fuel.
- Absorption, TrappedTraders and Exhaustion. The tutorial calls these the three ways a move dies, scored per symbol. Absorption is heavy aggressive volume meeting a passive wall while price refuses to move.
- LiquiditySweep and StopRun. Where stops were taken before the real move.
- OiDelta, OiBarClass and OiSessionPct. Whether the activity is opening or closing positions.
- SetupStage, LastEvent and ActiveSignals. Everything firing now, in one place, so nothing fires while you were looking elsewhere.
For how these events look on the footprint itself, read our footprint reversal signals guide.
Elliott Wave and Open Interest: the context columns
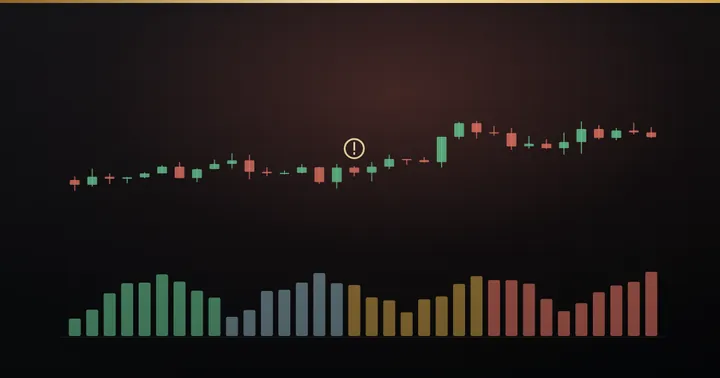
The Mirra Master EW Scanner runs the identical wave engine as the indicator across your Market Analyzer watchlist. That engine checks every count against the hard Elliott rules on two degrees: wave 2 may not retrace all of wave 1, wave 3 is never the shortest, and wave 4 may not overlap wave 1. A count that breaks a rule is rejected.
On the scanner, the useful question is “which symbols are near a decision point in the wave count?” On the indicator, the Profit-Taking Index (PTI) is the tell to look at: above 35 favours a fifth wave still to come; below 35 warns the trend may already be done. Wave 4 retracement zones are graded green 24–38%, amber 38–50% and red 50–62%. More in our Elliott Wave exhaustion post.
Open Interest is the thread that ties all three together. Both the Market Profile and Order Flow scanners carry OI columns, and the four buildup states are simple:
- Price up, OI up: long buildup — fresh money buying.
- Price down, OI up: short buildup — new sellers committing.
- Price up, OI down: short covering — a squeeze that can run out.
- Price down, OI down: long unwinding — longs leaving.
A stock rallying on short covering and a stock rallying on long buildup look identical on a candle. On the grid they sit in different rows once you sort by buildup. See our OI intraday guide for more.
A worked example, and what would prove it wrong
An illustrative case, with made-up prices.
Say it is 10:20 IST. On the Market Profile grid, a banking stock future has a MirraScore that has turned negative, a poor high flag on today’s session near 1,642, and little value-area overlap with yesterday, with value sitting lower. On the Order Flow grid, the same symbol shows CumDeltaDivergence on the last push to 1,642 and an Absorption event in LastEvent. The OI columns show price up, OI down — short covering, not fresh longs.
Three independent lenses — structure, flow and positioning — are leaning the same way. That does not mean the stock will fall. It means the probability of a failed push has gone up enough to open the chart and plan.
That is the habit to build: every row that makes your watchlist gets a written “this is wrong if…” level before you touch the order window.
Custom scanner rules and alerts without the overload
Sorting is good. Being told is better. The October 2026 release added custom scanner rules to both the Market Profile and Order Flow scanners:
- Five rule slots per column, with 19 operators, lookback windows and ANY/ALL logic.
- Flips, crosses and streaks. “Delta flipped positive in the last 10 minutes” is one setting; so is a value that held for 15 minutes.
- Named alerts, so the pop-up tells you which rule fired, not just that something did.
- Copy-ready recipes on the Order Flow side for flips, sweeps and absorption clusters.
On market scanner alerts, the defaults are sensible. Per-event alerts are off by default, every event has its own switch, and alerts fire on live bars only, so you are not flooded by historical events when you load the grid. The Order Flow scanner has nine event switches, a repeat option and a re-arm cooldown per symbol for sound and message alerts.
The fastest way to drown is to switch everything on. Some guardrails:
- Start with ten to twenty symbols you actually trade. The OF tutorial is blunt: a hundred rows of unfamiliar instruments is noise, not an edge.
- Set one alert first. Add a second only when the first has earned its place over a week.
- Prefer ALL logic for alerts (two conditions agreeing) and ANY logic for highlighting.
- Use the cooldown so one choppy stock cannot ping you every minute.
A step-by-step morning set-up
A practical intraday stock scanner India routine for NSE hours. Adjust times to your style.
- Before 9:00 IST — build the list. Load your F&O watchlist, or start with a nifty 50 scanner list of the stocks you know, plus Nifty and Bank Nifty futures. Keep it to symbols you would actually trade.
- Load a layout. The Market Profile Scanner comes with three ready-made column sets — scan, confirm and manage. Start with scan. Confirm your settings match your chart.
- Check data health. Glance at the health column and drop any row it flags.
- Mark the magnets. Sort by untested POCs and unfilled gaps so you know which stocks have a level pulling on them.
- 9:15–10:15 — let the IB form. Do not chase. Watch AiScore and delta columns to see where aggression is concentrating.
- After the first hour — sort by IB break and MirraScore. Then cross-check the Order Flow grid for absorption, divergence or traps on the same names, and the OI buildup class.
- Shortlist two or three. Only symbols where at least two lenses agree. Write the invalidation level for each.
- Open charts, arm one alert, step back. Let the grid call you back instead of staring at it.
We walk through the scanner live in our free weekly webinars, including a session on Advanced Market Profile with Mirra AI and the Scanner. If you want to try it on your own list, the indicators are on the products page with a free 5-day trial, and plans are on pricing.
Frequently asked
What is a stock scanner in NinjaTrader?
In NinjaTrader 8 a scanner runs inside the Market Analyzer, a grid where each row is an instrument and each column is a value. The Mirra scanners fill those columns with the same maths as their chart indicators, so you can sort the whole list at once.
Can I scan the full F&O list with Mirra scanners?
The Market Profile and Order Flow scanners are built to run across 100+ symbols. Still, start with ten to twenty symbols you actually trade, because a long list of unfamiliar names is noise, not an edge.
Do the scanners show Open Interest?
Yes. Both the Market Profile and Order Flow scanners carry OI columns such as session OI change and buildup class. OI features need an Accelpix Pix Connect feed.
How do I stop getting too many scanner alerts?
Per-event alerts are off by default and fire on live bars only. Switch on one alert at a time, combine conditions with ALL logic, and use the per-symbol re-arm cooldown on the Order Flow scanner.
Does a high MirraScore or AiScore mean the stock will move?
No. The scores are early warnings that raise or lower the odds, not predictions. Always open the chart, confirm with a second lens, and write down the level that would prove the idea wrong.
Educational content only — not investment advice. Examples are illustrative. Trading in securities, derivatives, crypto and forex involves substantial risk of loss.